


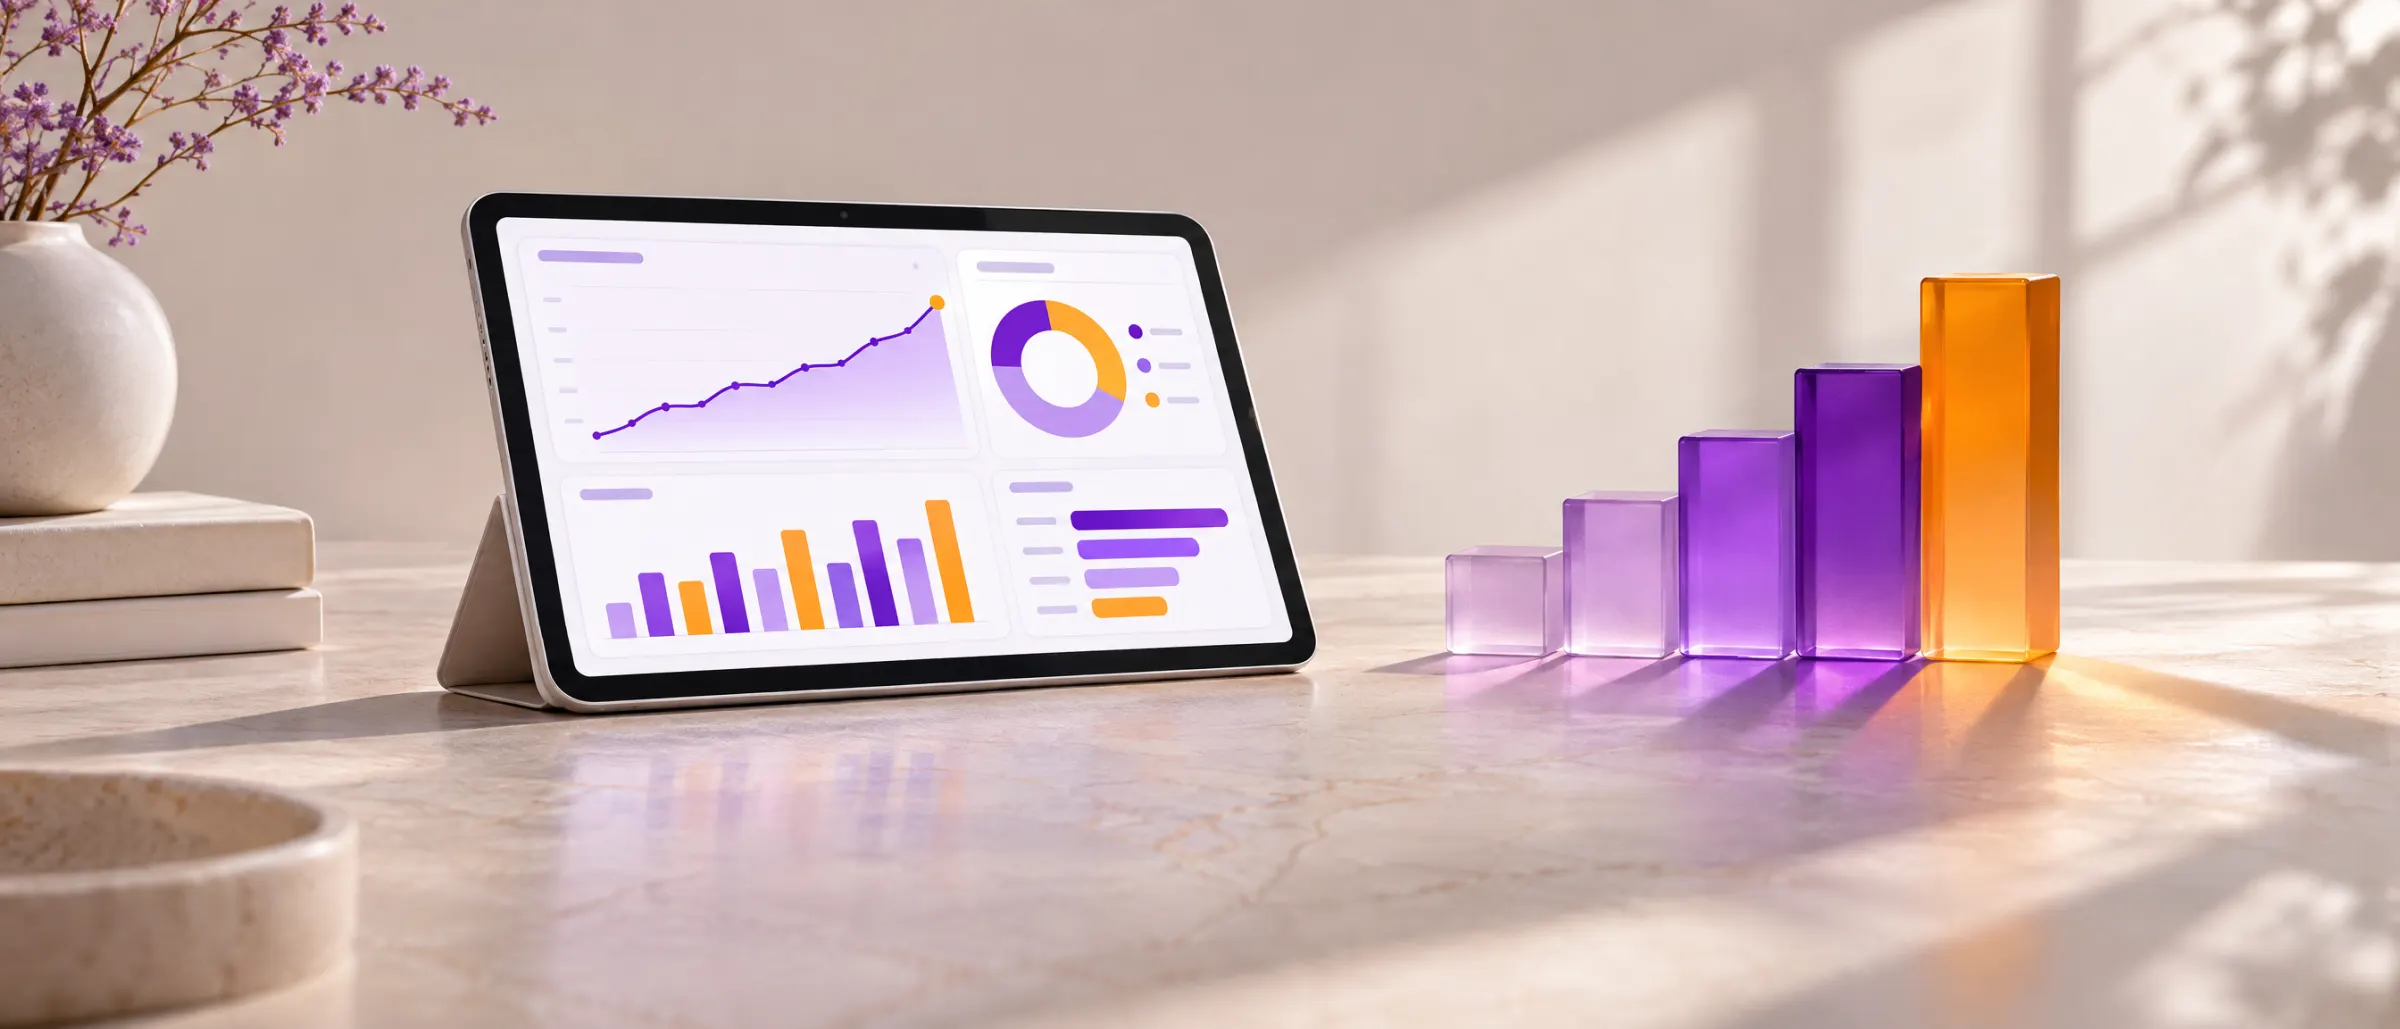
Dashboards and custom reports that bring your organisation’s data into one clear view, so you can see what is working and decide what to do next.
Your data sits in many places: your website, your social media and the systems you run the organisation on. We agree the questions that matter to you, connect those sources and bring them together in one dashboard, shaped to your brand and explained in plain language. Where you need them, we also send reports on the schedule you choose.
Discuss your dataWhat we help solve
Your numbers are in too many places
Website visits in one tool, social media in another, sales in a spreadsheet and enquiries in an inbox. We bring them into one dashboard, so a simple question no longer means logging in to five places.
Reports take days to put together
Someone on your team spends the end of every month copying figures into a spreadsheet. We automate the collection, so the report is ready on time and that person gets those days back.

Different teams quote different numbers
When each team counts enquiries or sales its own way, meetings turn into arguments about whose figure is right. We agree one definition for each measure and use it everywhere.

You have charts but no answers
A dashboard full of graphs is not the same as knowing what to do. We start from the questions you need answered and add plain-language notes on what changed and what to try next.
What we do
- 01
Questions & measures
We start with the decisions you make and the questions behind them, then agree a short list of measures that answer them, each with a clear definition and someone who owns it.
- 02
Connecting your sources
Website analytics, social media accounts, email tools, forms, sales records and the other systems you use, connected so the numbers update on their own instead of being copied by hand.
- 03
Cleaning & combining data
We fix duplicates, mismatched names and gaps, and match records across sources, so the totals add up and your team can trust what they see.
- 04
Dashboard design
One dashboard in your brand, with the most important numbers first, clear charts, and filters for the view each team needs, on a laptop or a phone.
- 05
Scheduled reports
Weekly, monthly or quarterly reports sent to the people who need them, in a form they will actually open: a short email, a PDF or a few slides.
- 06
Insight & training
Plain-language notes on what changed and what to try next, and a short handover so your team can read the dashboard, change a filter and answer their own questions.
How a project runs
- 01
Discovery
We learn how your organisation runs, which decisions the numbers should support and who will use them. We list the data you have, where it lives and who can give us access.
- 02
Measures & data plan
We agree the measures, how each one is counted and which sources feed it, and sketch the dashboard and the first report before anything is built.
- 03
Connect & clean
We connect the sources, clean and match the data, and check the totals against figures you already trust, so there are no surprises later.
- 04
Build & review
We build the dashboard and the first report, then go through them with the people who will use them and change whatever is unclear.
- 05
Launch & handover
We set the reports to send on schedule, walk your team through the dashboard, and check in after the first month to refine it.
Typical timelines
- Review of your current reports and data1 – 2weeks
- Website and social media dashboard2 – 3weeks
- Dashboard with your sales or operations data3 – 5weeks
- Dashboard across several systems4 – 8weeks
- Full reporting set-up, with scheduled reports6 – 10weeks
These are typical ranges. The schedule depends mostly on your data: how many sources there are, how easy they are to get into, and how much cleaning they need.
Who we work with
Outgrown the spreadsheet
Your reports were set up when the team was small. We move them into a dashboard that keeps up as you add people, services and locations.
Reporting to funders
Track your programme indicators in one place and produce donor reports from the same numbers every time, instead of rebuilding them for each report.
Measure from day one
Building a new site with us? We set up the tracking and the dashboard at the same time, so you can see how it performs from launch.
We design and build websites, so we know where the numbers come from and how to set up tracking properly from the start. With design and development in one team, your dashboard is as clear and well made as the rest of your brand.
- 80+Projects delivered
For clients across hospitality, NGOs, education, farming and retail.
- 10+Years of experience
And we are still here when you need the next change.
- 6Team members
One small team, so nothing gets lost between the tracking and the dashboard.
Questions we often get
Which tools do you build dashboards in?
We choose the tool that fits your budget and the systems you already use, most often Looker Studio, Power BI or a dashboard built into your own website. We explain the trade-offs before we start.
Which data sources can you connect?
Most of the common ones: website analytics, social media accounts, email marketing, forms, spreadsheets, and accounting or sales systems. If a system can export its data or has an API, we can usually bring it in, and we tell you early if something cannot be connected.
How often do the numbers update?
It depends on the source. Many connections update every day or more often; some systems only allow a weekly or manual export. We agree the right rhythm for each measure.
What if our data is messy?
Most data is. Cleaning and matching it is part of the work. We show you what we found and what we fixed, so your team can keep it tidy from then on.
How do you keep our data safe?
We ask only for the access we need, use read-only access wherever we can, and leave personal details out of dashboards unless there is a reason to include them. We work in line with Kenya’s Data Protection Act, 2019.
Can you keep reporting for us each month?
Yes. We can send and explain your reports each month and update the dashboard as your goals change, or hand it over fully to your team. If you also need a new website to track, see our Design & Development service.